Grafana

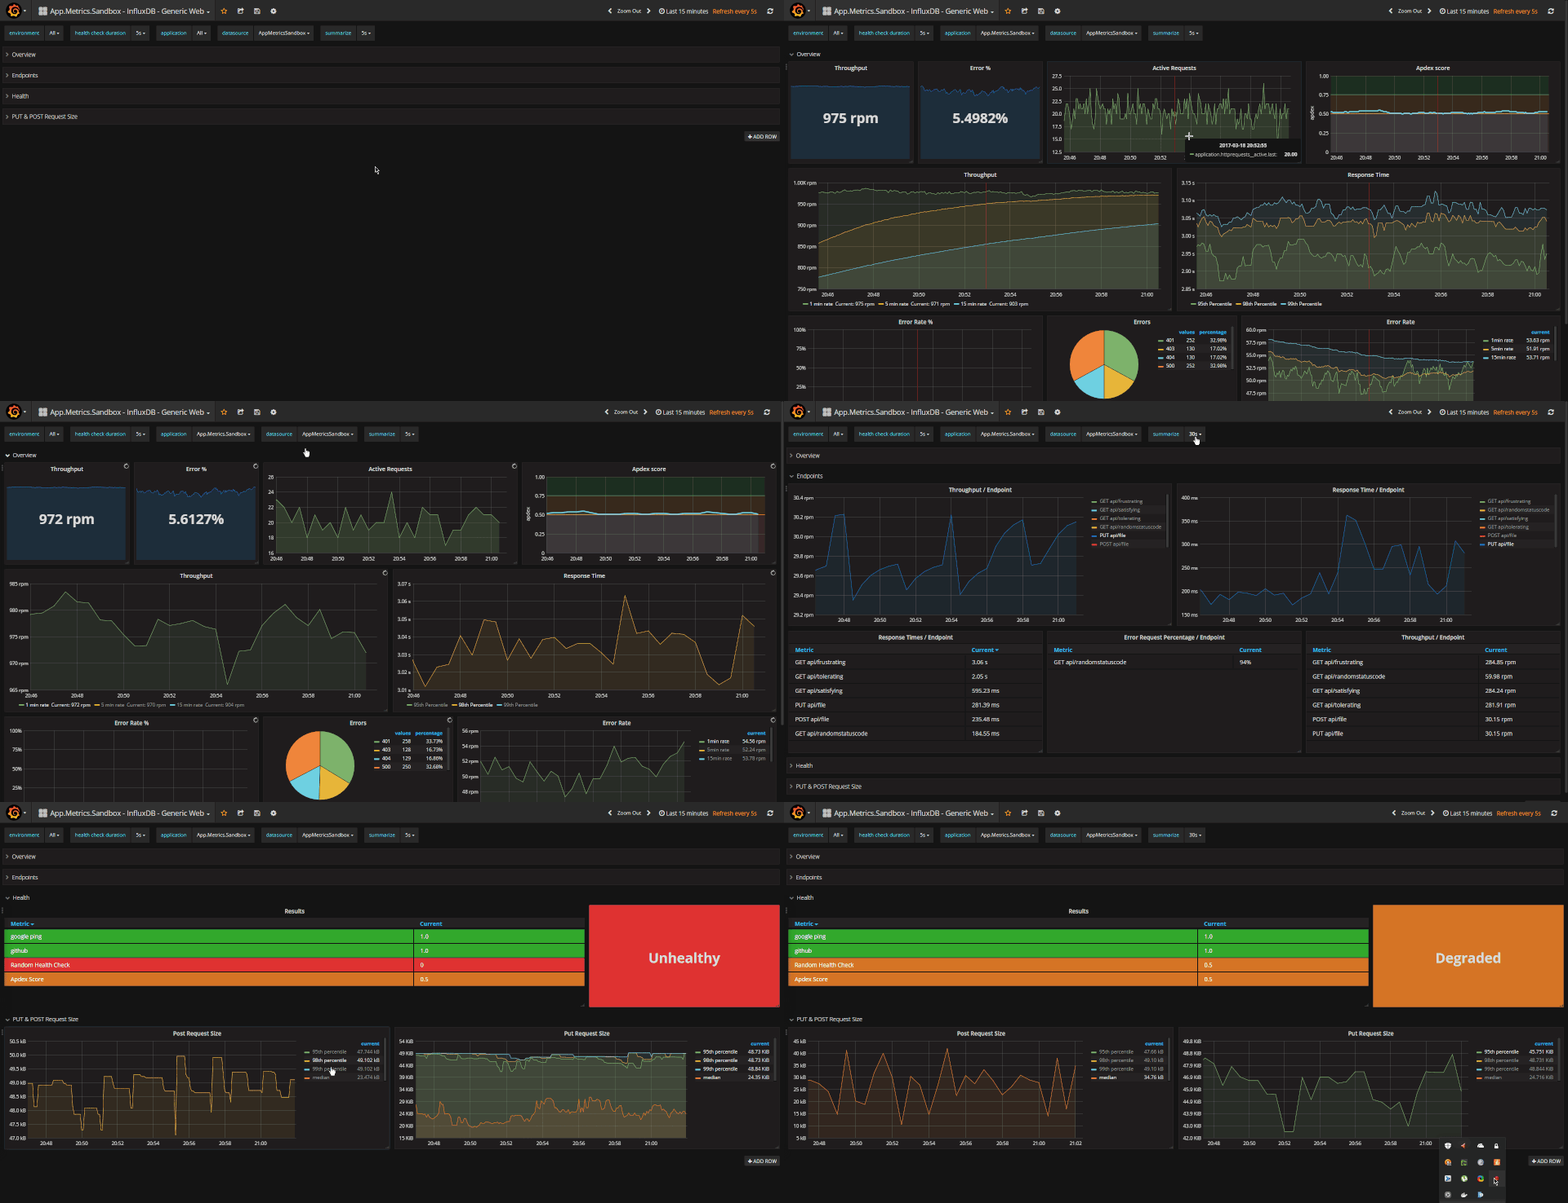
Out-of-box, App.Metrics includes Grafana dashboards that are built to monitor metrics reported by ASP.NET Core application’s that are using the App.Metrics.AspNetCore.Tracking nuget pacakge.
Dashboard Features
Web Monitoring
- Metrics recorded by App Metrics ASP.NET Core Tracking are pre-configured in the Grafana dashboard.
- Supports filtering graphs by environment allow the same dashbaord to be re-used across environments.
- Supports filtering graphs by application. The idea is to tag metrics by your application’s name allowing you to re-use the same dashboard instance for all web applications using App Metrics.
- Graphs are configured to use a
datasourcetemplate variable so that you don’t need to update all charts with the datasource you configured in Grafana. - Display a health overview showing passed, degraded and failed checks as well as an overall health status, color coded by the status value. (Not yet available in App Metrics 2.0)

Get the Grafana Dashboards
OAuth2 Monitoring
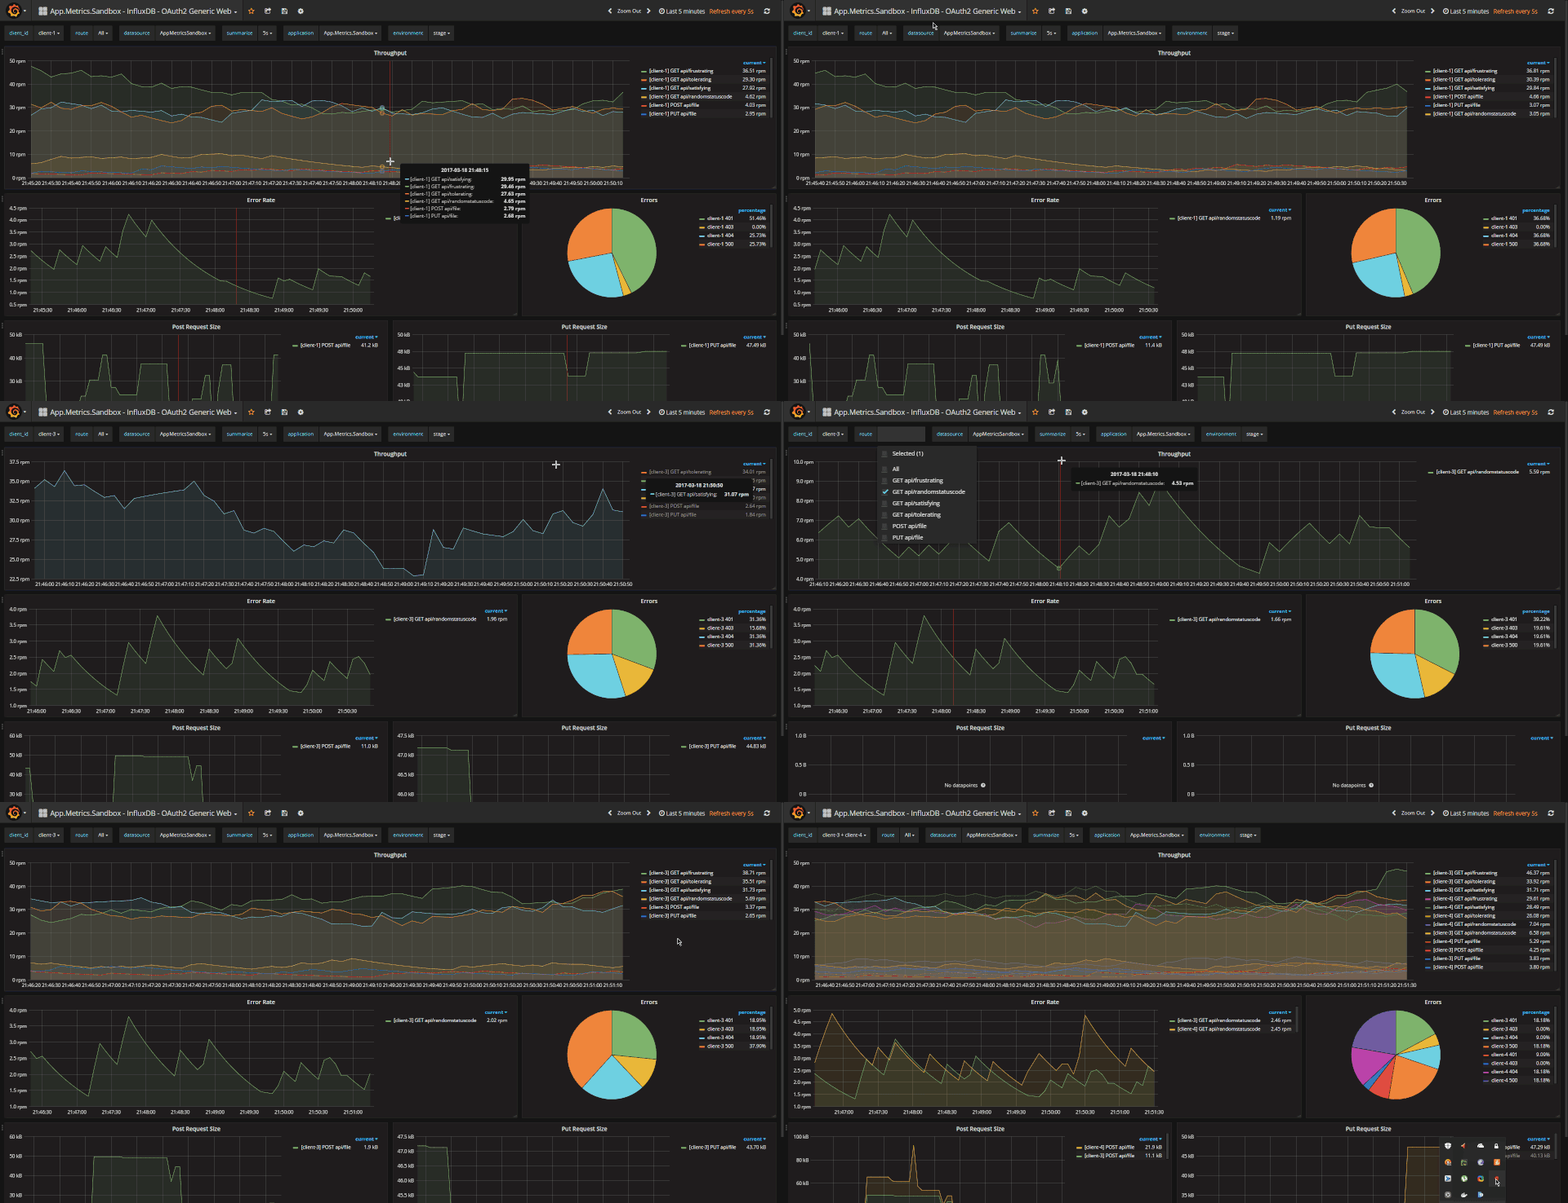
- OAUth2 Metrics measured by App Metrics ASP.NET Core Tracking are pre-configured in the Grafana dashboard.
- Supports filtering graphs by environment, application and datasource as explained above.
- Supports filtering graphs by
client_idso that we can visualize request rates for example on each API endpoint, useful for example to determine client rate limits or what versions clients are using. - Supports filtering graphs by
route, allowing us to more clearly visualize a clients usage of a specific endpoint.

Get the Grafana Dashboards
How to setup the dashboards
- Configure your application to use App Metrics ASP.NET Core Tracking and Reporting targetting the time series database of choice.
- Run your application to report some metrics.
- Download and install Grafana, then create a new datasource specifying the reporter’s details configured as part of your application setup.
- Import the desired Grafana dashboard(s) by copying and pasting the dasboard ID into the Import Dashboard window in Grafana
The Grafana dashboards expect app, env and server global tags to be set.